Debugging Tabris.js
Tabris.js provides a global console object with various useful logging functions including console.trace(). The developer console also allows entering javascript commands at runtime, as does the CLI using the -i switch, e.g. tabris serve -i. Since the tabris module exports are available as a global object the application state can be inspected. For example:
Print the app version:
console.log(tabris.app.version);
The CLI also provides various keyboard shortcuts to interact with the connect app.
Android
The Tabris.js Android client executes the application logic on the v8 javascript engine. This allows to use the v8 inspector protocol to debug a Tabris.js application with any compatible client.
Setup
Developer machine
- Debugging is supported on all operating systems
- Compatible clients: Chrome DevTools, Visual Studio Code, WebStorm and more
Android device
- An installed Tabris.js app that has been built in debug mode, either locally or via the Tabris.js build service. The Tabris.js developer app from the app stores is not debuggable since the app is built in release mode.
- OPTIONAL: When debugging on the Android emulator, its port has to be forwarded to the local machines port. Since the default debug port of a Tabris.js app is
9090the port can be forwarded via the adb command:adb forward tcp:9090 tcp:9090
How to debug
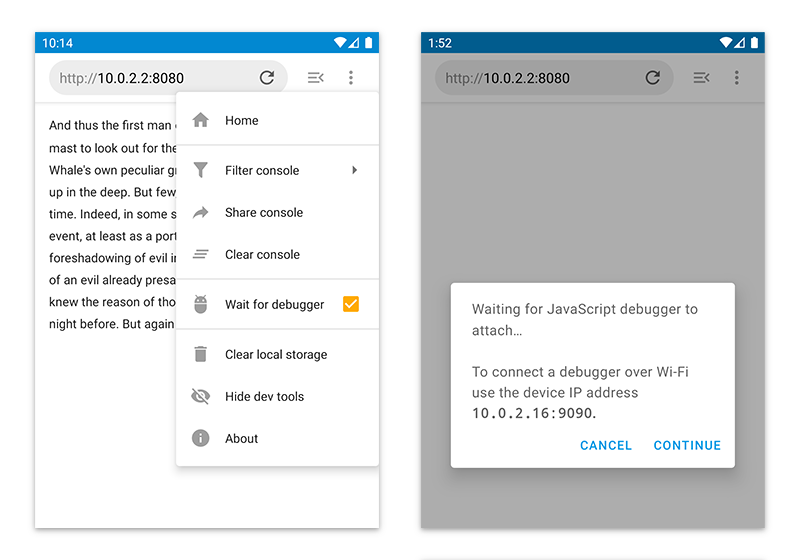
When launching a Tabris.js Android app, its debugger port is automatically opened on port 9090. The app will start as usual and a debug client can connect to the app at any point in time. If you want to debug the app during startup you can activate the option “Wait for debugger” in the on-device DevTools menu. This will delay app startup until a debug client is connected.
The debugger may not always break at a top level breakpoint, even when waiting for the debugger. To force the connected debugger to stop in the top level execution flow, the debugger; statement can be used:
debugger; // the debugger will stop here

// more app code
Chrome DevTools
To connect the Chrome DevTools to a Tabris.js app on the default port 9090, the following URL should be entered:
devtools://devtools/bundled/inspector.html?experiments=true&v8only=true&ws=<device-ip>:9090
If the URL can not be found, try to open “devtools://devtools/bundled/inspector.html” without the parameters first, then the full URL.
Exchange <device-ip> with the IP of your Android device.
Visual Studio Code
Visual Studio Code requires a launch configuration to connect to the Android device. It has to be inserted into the file .vscode/launch.json. When a Tabris.js app is created with the tabris-cli init command, the configuration is already in place.
{
  "version": "0.2.0",
  "inputs": [
    {
      "id": "debugAddress",
      "type": "promptString",
      "default": "localhost",
      "description": "IP address of Android device"
    }
  ],
  "configurations": [
    {
      "name": "Debug Tabris.js on Android",
      "type": "node",
      "protocol": "inspector",
      "request": "attach",
      "port": 9090,
      "address": "${input:debugAddress}",
      "stopOnEntry": false,
      "cwd": "${workspaceFolder}",
      "trace": true,
      "sourceMaps": true,
      "restart": true,
      "skipFiles": [
        "node_modules/**/*.js"
      ]
    }
  ]
}
To debug your Tabris.js application on an Android device first click the debug icon on the Visual Studio Code activity bar. This opens the debug side bar where the launch configuration “Debug Tabris on Android” can be started. A UI prompt will ask for the device’s IP address.
WebStorm
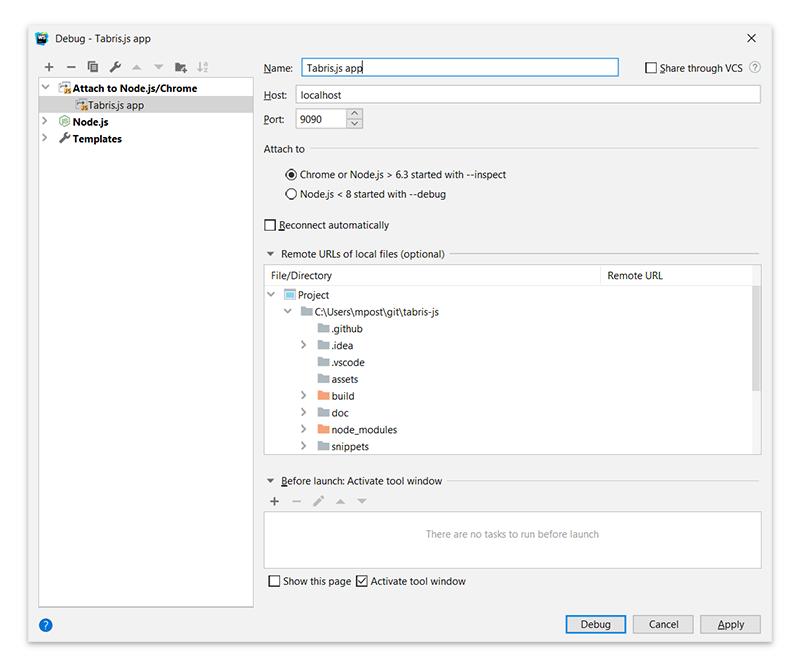
Debugging on WebStorm is done with a Node.js launch configuration. Select “Run -> Debug…“ from the main menu and selection “Edit Configurations…“ from the popup. In the following dialog add a new configuration “Attach to Node.js/Chrome” with the device IP address and the default debug port 9090.
Select the “Debug” button and WebStorm will connect to the Tabris.js debugger.
iOS
Setup
Developer machine
- Requires macOS
- Safari Browser, with the developer Menu enabled under “Safari -> Preferences -> Advanced”.
iOS device
- An installed Tabris.js app that has been built in debug mode, either locally or via the Tabris.js build service.
- Web Inspector enabled in “Settings -> Safari -> Advanced”
How to debug
- Connect your iOS device via USB directly to the developer machine.
- Start the Tabris.js app.
- In Safari go to “Develop -> {name-of-your-device} -> {name-of-your-app} -> JSContext” (If there are multiple entries, kill and restart the entire app)
- Go to the “Resources” tab and set a breakpoint.